

Based on your knowledge of the relation of the t and F distributions, complete the accompanying software
Question:
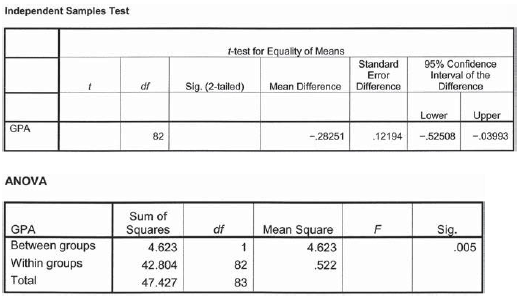
a. What is the F statistic? Show your calculations.
b. What is the t statistic? Show your calculations.
c. In statistical software output, €œSig.€ refers to the actual p level of the statistic. We can compare the actual p level to a cutoff p level such as 0.05 to decide whether to reject the null hypothesis. For the t test, what is the €œSig.€? Explain how you determined this.
Fantastic news! We've Found the answer you've been seeking!
Step by Step Answer:
a b t F 8856 298 c The Sig for t is the same as that for the ANOVA 0005 because the F ...View the full answer

Answered By
Vikash Gupta
I am graduated in Physics in 2018, from KIRORIMAL COLLEGE, University of Delhi. Now I am persuing Master's degree in physics. I like to do physics problems. I have experience of 1 year in tutoring. I think Physics is the only subject where you understand things,how they are happening . In physics you learn Maths and apply it. So I would like to join your platform to solve many Physics problems.
5+ Reviews
10+ Question Solved
Related Book For 

Essentials Of Statistics For The Behavioral Sciences
ISBN: 9781464107771
3rd Edition
Authors: Susan A. Nolan
Question Posted:
