

Review Exhibit 612, which is a Tableau portrayal of the regression results for Donut Desires five donut
Question:
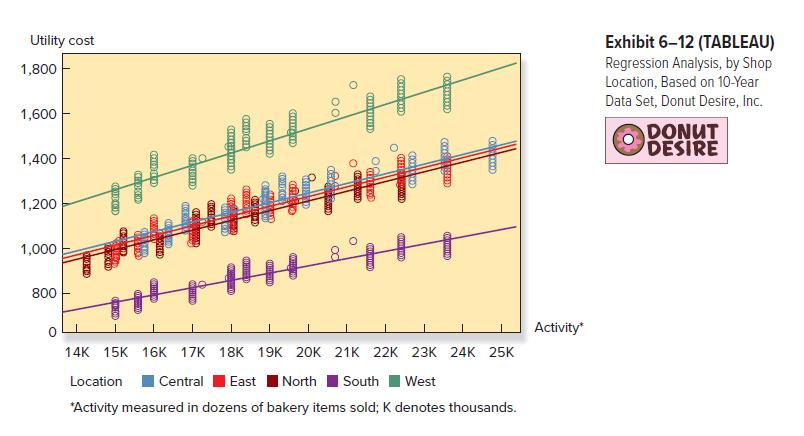
Review Exhibit 6–12, which is a Tableau portrayal of the regression results for Donut Desire’s five donut shop locations, based on the entire 10-year data set (i.e., the past 10 years).
Required:
The regression equation for the North shop location’s utility cost, based on the 10-year data set (displayed graphically in Exhibit 6–12) was given in the chapter as follows (with rounding):
Fantastic news! We've Found the answer you've been seeking!
Step by Step Answer:
1 The intercept in the North shops ...View the full answer

Answered By
Hillary Waliaulah
As a tutor, I am that experienced with over 5 years. With this, I am capable of handling a variety of subjects.
17+ Reviews
30+ Question Solved
Related Book For 

Managerial Accounting Creating Value In A Dynamic Business Environment
ISBN: 9781264100699
13th Edition
Authors: Ronald Hilton, David Platt
Question Posted:
