

In the following graph, D represents the demand for dishwashers facing the All clean Company. The firm
Question:
In the following graph, D represents the demand for dishwashers facing the All clean Company. The firm manufactures dishwashers in two plants; MC1 and MC2 are their marginal cost curves.
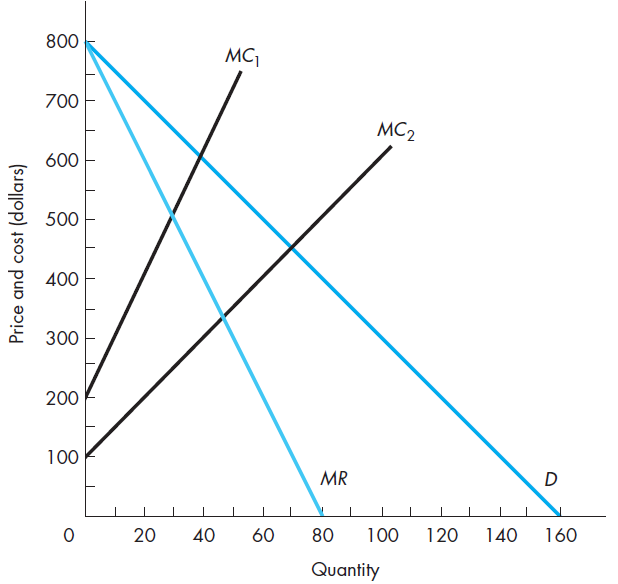
a. How many dishwashers should the firm produce?b. What price should the firm set?c. How should the output be allocated between the two plants so as to maximize profit?
Fantastic news! We've Found the answer you've been seeking!
Step by Step Answer:
Answer a This is a multiplant problem where we have 2 marginal cost curves and one marginal revenue curve For profit maximization the individual plant ...View the full answer

Related Book For 

Managerial Economics Foundations of Business Analysis and Strategy
ISBN: 978-0078021909
12th edition
Authors: Christopher Thomas, S. Charles Maurice
Question Posted:
