

The left-hand side of the following graph shows market demand and supply curves in a competitive market.
Question:
The left-hand side of the following graph shows market demand and supply curves in a competitive market. Draw the demand facing a competitive firm selling in this market on the right-hand graph.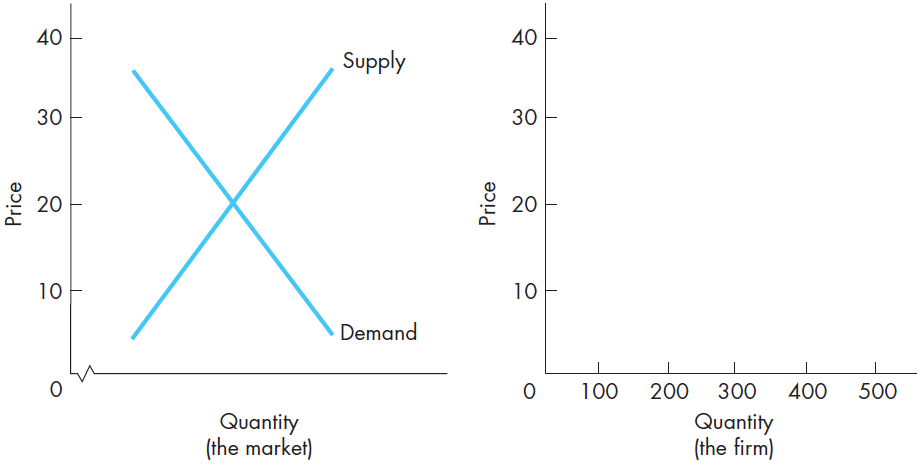
a. What is the firm?s demand elasticity at 200 units of output? At 400 units?b. What is the firm?s marginal revenue from selling the 200th unit of output? From the 400th unit?
Fantastic news! We've Found the answer you've been seeking!
Step by Step Answer:
a What is the firms demand elasticity at 200 units of output At 400 units In perfectly competitive m...View the full answer

Answered By
Lalit Vaghela
I have done MBA in finance but I am more interested in economics subject. Currently I am doing job in NBFC as credit manager. Along with this I have tutoring experience of two years in two different websites.
Linked in https://www.linkedin.com/in/lalit-vaghela-5b8590116/
0 Reviews
10+ Question Solved
Related Book For 

Managerial Economics Foundations of Business Analysis and Strategy
ISBN: 978-0078021909
12th edition
Authors: Christopher Thomas, S. Charles Maurice
Question Posted:
