The following table gives data collected by a convenience store chain for 20 of its stores. Column
Question:
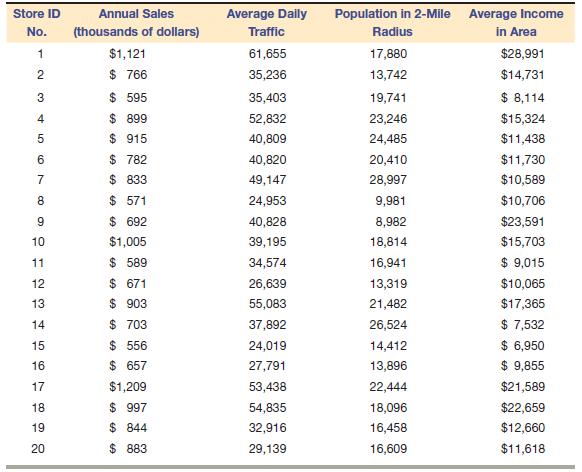
The following table gives data collected by a convenience store chain for 20 of its stores.
Column 1: ID number for each store
Column 2: Annual sales for the store for the previous year in thousands of dollars
Column 3: Average number of vehicles that pass the store each day, based on actual traffic counts for one month
Column 4: Total population that lives within a two-mile radius of the store, based on 1990 census data
Column 5: Median family income for households within a two-mile radius of the store, based on 2000 census data
Answer the following:
a. Which of the other three variables is the best predictor of sales? Compute correlation coefficients to answer the question.
b. Do the following regressions:
(1) Sales as a function of average daily traffic
(2) Sales as a function of population in a two-mile radius
c. Interpret the results of the two regressions.
Step by Step Answer:
Answer I a Best Predictor of Sales Correlation Coefficients Sales vs Traffic 073 strong positive correlation Sales vs Population 057 moderate positive ...View the full answer