

A student theater group at a university has developed a demand schedule that shows the relationship between
Question:
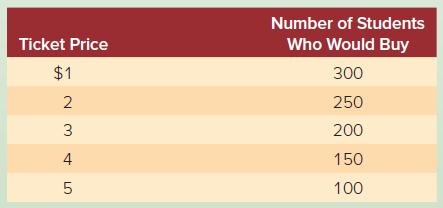
A student theater group at a university has developed a demand schedule that shows the relationship between ticket prices and demand based on a student survey (see the table that follows).
(a). Graph the demand curve and the total revenue curve based on these data. What ticket price might be set based on this analysis?
(b). What other factors should be considered before the final price is set?
Fantastic news! We've Found the answer you've been seeking!
Step by Step Answer:
a The graph above show the demand and total revenue based on the data given b some additional factor...View the full answer

Answered By
Mugdha Sisodiya
My self Mugdha Sisodiya from Chhattisgarh India. I have completed my Bachelors degree in 2015 and My Master in Commerce degree in 2016. I am having expertise in Management, Cost and Finance Accounts. Further I have completed my Chartered Accountant and working as a Professional.
Since 2012 I am providing home tutions.
2+ Reviews
10+ Question Solved
Related Book For 

Question Posted:
