

a. For the population, find the proportion of odd numbers. b. Table 6-2 describes the sampling distribution
Question:
a. For the population, find the proportion of odd numbers.
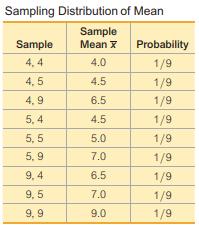
b. Table 6-2 describes the sampling distribution of the sample mean. Construct a similar table representing the sampling distribution of the sample proportion of odd numbers. Then combine values of the sample proportion that are the same, as in Table 6-3.
c. Find the mean of the sampling distribution of the sample proportion of odd numbers.
d. Based on the preceding results, is the sample proportion an unbiased estimator of the population proportion? Why or why not?
Use the same population of {4, 5, 9} that was used in Examples 2 and 5. As in Examples 2 and 5, assume that samples of size n = 2 are randomly selected with replacement.
Step by Step Answer:
To find the sampling distribution of the sample proportion of odd numbers from the given population ...View the full answer


Mathematical Interest Theory
ISBN: 9781470465681
3rd Edition
Authors: Leslie Jane, James Daniel, Federer Vaaler
