

Consider the probability distribution defined by the formula where x can be any value between 0 and
Question:
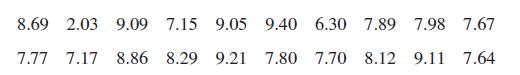
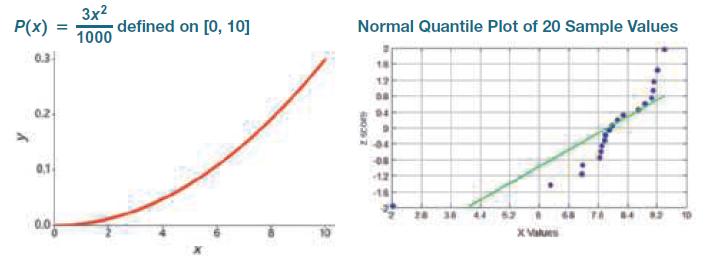
Consider the probability distribution defined by the formula ![]() where x can be any value between 0 and 10 inclusive (not just integers). The accompanying graph of this probability distribution shows that its shape is very far from the bell shape of a normal distribution. This probability distribution has parameters μ = 7.5 and σ = 1.93649. Listed below is a simple random sample of values from this distribution, and the normal quantile plot for this sample is shown. Given the very non-normal shape of the distribution, it is not surprising to see the normal quantile plot with points that are far from a straight-line pattern, confirming that the sample does not appear to be from a normally distributed population.
where x can be any value between 0 and 10 inclusive (not just integers). The accompanying graph of this probability distribution shows that its shape is very far from the bell shape of a normal distribution. This probability distribution has parameters μ = 7.5 and σ = 1.93649. Listed below is a simple random sample of values from this distribution, and the normal quantile plot for this sample is shown. Given the very non-normal shape of the distribution, it is not surprising to see the normal quantile plot with points that are far from a straight-line pattern, confirming that the sample does not appear to be from a normally distributed population.
a. Mean Test the claim that the 20 given sample values are from a population having a mean equal to 7.5, which is the known population mean. Because the sample is not from a normally distributed population and because n = 20 does not satisfy the requirement of n > 30, we should not use the methods of Section 8-3. Instead, test the claim by using the confidence interval method based on a bootstrap sample of size 1000. Use a 0.05 significance level. Does the bootstrap confidence interval contain the known population mean of 7.5? Is the bootstrap method effective for this test? What happens if we conduct this test by throwing all caution to the wind and constructing the 95% confidence interval by using the t distribution as described in Section 7-2?
b. Standard Deviation Test the claim that the 20 sample values are from a population with a standard deviation equal to 1.93649, which is the known population standard deviation. Use the confidence interval method based on a bootstrap sample of size 1000. Use a 0.05 significance level. Does the bootstrap confidence interval contain the known population standard deviation of 1.93649? Is the bootstrap method effective for this test? What happens if we conduct the test by throwing all caution to the wind and constructing the 95% confidence interval by using the x2 distribution as described in Section 7-3?
Step by Step Answer:

This question has not been answered yet.
You can Ask your question!


Mathematical Interest Theory
ISBN: 9781470465681
3rd Edition
Authors: Leslie Jane, James Daniel, Federer Vaaler
