

Data Set 21 Earthquakes in Appendix B includes the depths (km) of the sources of 600 earthquakes.
Question:
Data Set 21 “Earthquakes” in Appendix B includes the depths (km) of the sources of 600 earthquakes. Use technology for the following.
a. Find the mean and standard deviation of the 600 depths.
b. Generate a histogram and normal quantile plot of the 600 depths. Does it appear that the depths are from a population having a normal distribution? Explain.
c. In obtaining a 95% confidence interval estimate of the depth of all earthquakes, are the requirements for using a t distribution satisfied? Explain.
d. Find a 95% confidence interval estimate of the depth of all earthquakes using the t distribution.
e. Find a 95% confidence interval estimate of the depth of all earthquakes using 1000 bootstrap samples.
f. Compare the results from parts (d) and (e). Which confidence interval is likely to be better? Why?
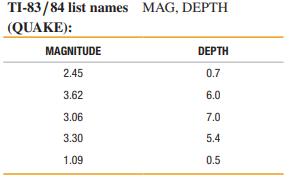
Data Set 21: Earthquakes
Data are from 600 matched pairs (first five rows shown here) of magnitude/depth measurements randomly selected from 10,594 earthquakes recorded in one year from a location in southern California. Only earthquakes with a magnitude of at least 1.00 are used. MAGNITUDE is magnitude measured on the Richter scale and DEPTH is depth in km. The magnitude and depth both describe the source of the earthquake. The data are from the Southern California Earthquake Data Center.
Step by Step Answer:

This question has not been answered yet.
You can Ask your question!


Mathematical Interest Theory
ISBN: 9781470465681
3rd Edition
Authors: Leslie Jane, James Daniel, Federer Vaaler
