

Data Set 7 IQ and Lead in Appendix B lists performance IQ scores for a random sample
Question:
Data Set 7 “IQ and Lead” in Appendix B lists performance IQ scores for a random sample of subjects with low lead levels in their blood and another random sample of subjects with high lead levels in their blood. Use a 0.05 significance level to test the claim that subjects with low lead levels have a higher median of the performance IQ score than those with high lead levels. Does lead exposure appear to have an adverse effect?
Data Set 7: IQ and Lead
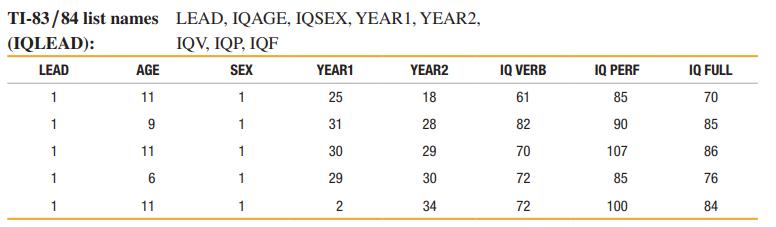
Data are from 121 subjects (first five rows shown here). Data are measured from children in two consecutive years, and the children were living close to a lead smelter. LEAD is blood lead level group [1 = low lead level (blood lead levels 6 40 micrograms/100 mL in both years), 2 = medium lead level (blood lead levels Ú 40 micrograms/100 mL in exactly one of two years), 3 = high lead level (blood lead level Ú 40 micrograms/100 mL in both years)]. AGE is age in years, SEX is sex of subject (1 = male; 2 = female). YEAR1 is blood lead level in first year, and YEAR2 is blood lead level in second year. IQ VERB is measured verbal IQ score. IQ PERF is measured performance IQ score. IQ FULL is measured full IQ score.
Data are from “Neuropsychological Dysfunction in Children with Chronic Low-Level Lead Absorption,” by P. J. Landrigan, R. H. Whitworth, R. W. Baloh, N. W. Staehling, W. F Barthel, and B. F. Rosenblum, Lancet, Vol. 1, No. 7909.
Step by Step Answer:


Mathematical Interest Theory
ISBN: 9781470465681
3rd Edition
Authors: Leslie Jane, James Daniel, Federer Vaaler
