

Dow Jones Industrial Average The following table shows information about each years Dow Jones Industrial average beginning
Question:
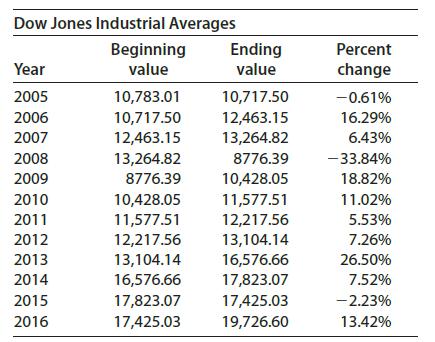
Dow Jones Industrial Average The following table shows information about each year’s Dow Jones Industrial average beginning value, ending value, and annual percent change for the years from 2005 to 2016. Let B be the set of years when the beginning value was less than 13,000. Let E be the set of years when the ending value was greater than 12,000. Let P be the set of years when the annual percent change was less than 7%.
(a) List the elements of B, E, and P.
(b) Is any of B, E, and P a subset of one of the others (besides itself)?
(c) Write a verbal description of P'.
(d) Find B' ∩ P' and describe it in words.
(e) Find E' ∩ P and describe it in words.
Step by Step Answer:
a L 2000 2001 2004 2005 2006 2007 2010 2011 2012 H 2000 2001 20...View the full answer


Mathematical Applications For The Management, Life And Social Sciences
ISBN: 9781337625340
12th Edition
Authors: Ronald J. Harshbarger, James J. Reynolds
