

Example 1 illustrated the use of two-way ANOVA to analyze the sample data in Table 12-3. How
Question:
Example 1 illustrated the use of two-way ANOVA to analyze the sample data in Table 12-3. How are the results affected in each of the following cases?
a. The same constant is added to each sample value.
b. Each sample value is multiplied by the same nonzero constant.
c. The format of the table is transposed so that the row and column factors are interchanged.
d. The first sample value in the first cell is changed so that it becomes an outlier.
Example 1:
Given the pulse rates in Table 12-3 (from Data Set 1 “Body Data” in Appendix B), use two-way analysis of variance to test for an interaction effect, an effect from the row factor of age bracket, and an effect from the column factor of gender. Use a 0.05 significance level.
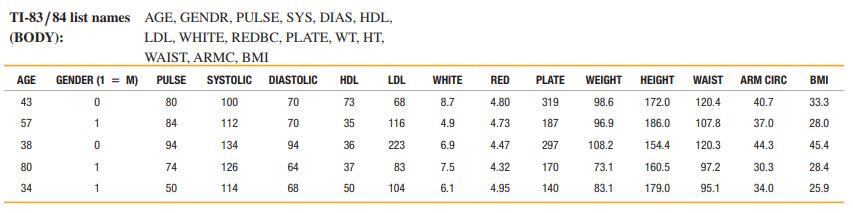
Table 12-3: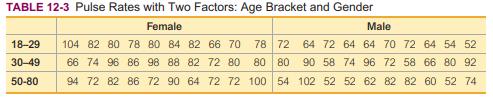 Data Set 1: Body Data
Body and exam measurements are from 300 subjects (first five rows shown here). AGE is in years, for GENDER 1 = male and 0 = female, PULSE is pulse rate (beats per minute), SYSTOLIC is systolic blood pressure (mm Hg), DIASTOLIC is diastolic blood pressure (mm Hg), HDL is HDL cholesterol (mg/dL), LDL is LDL cholesterol (mg/dL), WHITE is white blood cell count (1000 cells/mL), RED is red blood cell count (million cells/mL), PLATE is platelet count (1000 cells/mL), WEIGHT is weight (kg), HEIGHT is height (cm), WAIST is waist circumference (cm), ARM CIRC is arm circumference (cm), and BMI is body mass index (kg/m2). Data are from the National Center for Health Statistics.
Step by Step Answer:


Mathematical Interest Theory
ISBN: 9781470465681
3rd Edition
Authors: Leslie Jane, James Daniel, Federer Vaaler
