

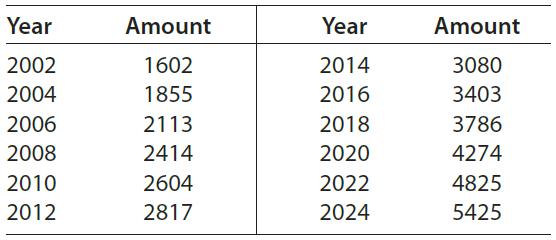
The following table shows the total national expenditures for health (in billions of dollars) for selected years
Question:
The following table shows the total national expenditures for health (in billions of dollars) for selected years from 2002 and projected to 2024. (These data include expenditures for medical research and medical facilities construction.)
Assume that these data can be modeled with the function
A(t) = 333(0.1t + 1)3 - 1830(0.1t + 1)2 + 4510(0.1t + 1) - 1750
where A(t) is in billions of dollars and t is the number of years after 2000.
(a) Find the function that models the instantaneous rate of change of total national health care expenditures.
(b) Use the model from part (a) to find and interpret the instantaneous rate of change of national health care expenditures in 2012 and 2020.
(c) Use the data to find an average rate of change from 2018 to 2022 that approximates the instantaneous rate of change for 2020.
Step by Step Answer:
a b The year 2012 corresponds to t 12 so A12 1293 The year 2020 corresponds to t 20 so A20 2521 Th...View the full answer


Mathematical Applications For The Management, Life And Social Sciences
ISBN: 9781337625340
12th Edition
Authors: Ronald J. Harshbarger, James J. Reynolds
