

A linear regression model for the propylene glycol data in Table 11 is P = 0.54T +
Question:
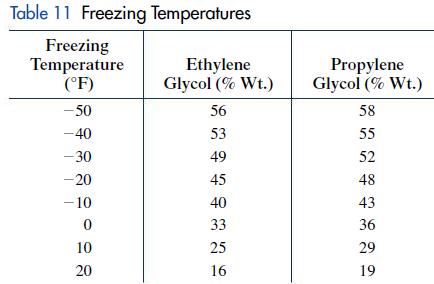
A linear regression model for the propylene glycol data in Table 11 is P = –0.54T + 34 where P is the percentage of propylene glycol in the deicing solution and T is the temperature at which the solution freezes.
(A) Draw a scatter plot of the data and a graph of the model on the same axes.
(B) Use the model to estimate the freezing temperature to the nearest degree of a solution that is 30% propylene glycol.
(C) Use the model to estimate the percentage of propylene glycol in a solution that freezes at 15°F.
Step by Step Answer:

This question has not been answered yet.
You can Ask your question!
Related Book For 

Finite Mathematics For Business Economics Life Sciences And Social Sciences
ISBN: 9780134862620
14th Edition
Authors: Raymond Barnett, Michael Ziegler, Karl Byleen, Christopher Stocker
Question Posted:
