

The data in Table 7 shows that the percentage of male cigarette smokers in the United States
Question:
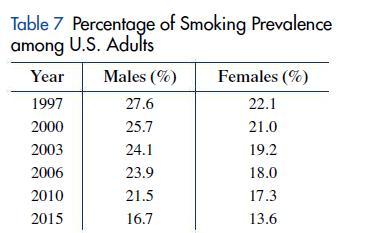
The data in Table 7 shows that the percentage of male cigarette smokers in the United States declined from 27.6% in 1997 to 16.7% in 2015.
(A) Applying linear regression to the data for males in Table 7 produces the model m = –0.56t + 27.82 where m is percentage of male smokers and t is time in years since 1997. Draw a scatter plot of the male smoker data and a graph of the regression model.
(B) Estimate the first year in which the percentage of male smokers is less than 10%.
Step by Step Answer:

This question has not been answered yet.
You can Ask your question!
Related Book For 

Finite Mathematics For Business Economics Life Sciences And Social Sciences
ISBN: 9780134862620
14th Edition
Authors: Raymond Barnett, Michael Ziegler, Karl Byleen, Christopher Stocker
Question Posted:
