

The financial department in Example 7, using statistical techniques, produced the data in Table 6, where C(x)
Question:
The financial department in Example 7, using statistical techniques, produced the data in Table 6, where C(x) is the cost in millions of dollars for manufacturing and selling x million cameras.
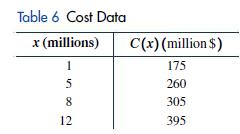
Using special analytical techniques (regression analysis), an analyst produced the following cost function to model the Table 6 data:
![]()
(A) Plot the data in Table 6. Then sketch a graph of equation ( 5) in the same coordinate system.
(B) Using the revenue function from Example 7(B), what is the company’s profit function for this camera, and what is its domain?
(C) Complete Table 7, computing profits to the nearest million dollars.
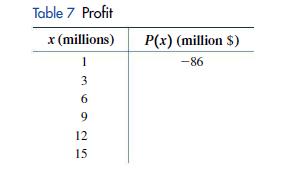
(D) Plot the data in Table 7. Then sketch a graph of the profit function using these points.
(E) Graph the profit function on a graphing calculator.
Data from Example 7
A manufacturer of a popular digital camera wholesales the camera to retail outlets throughout the United States. Using statistical methods, the financial department in the company produced the price–demand data in Table 4, where p is the wholesale price per camera at which x million cameras are sold. Notice that as the price goes down, the number sold goes up.
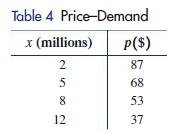
Using special analytical techniques (regression analysis), an analyst obtained the following price–demand function to model the Table 4 data:
![]()
Plot the data in Table 4. Then sketch a graph of the price–demand function in the same coordinate system.
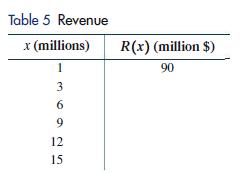
What is the company’s revenue function for this camera, and what is its domain?
Complete Table 5, computing revenues to the nearest million dollars.
Plot the data in Table 5. Then sketch a graph of the revenue function using these points.
Graph the revenue function on a graphing calculator.
Step by Step Answer:
A B C D E Milli...View the full answer


Finite Mathematics For Business Economics Life Sciences And Social Sciences
ISBN: 9780134862620
14th Edition
Authors: Raymond Barnett, Michael Ziegler, Karl Byleen, Christopher Stocker
