

To graph the equation y = x 3 + 3x, we use point-by-point plotting to obtain the
Question:
To graph the equation y = –x3 + 3x, we use point-by-point plotting to obtain the graph in Figure 4.
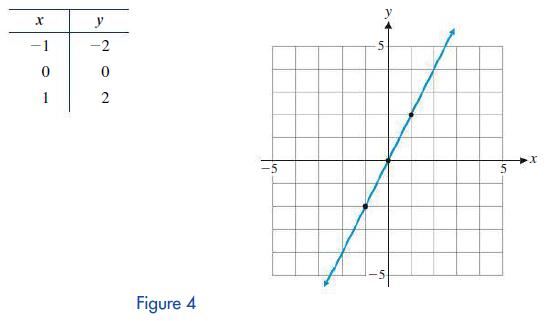
(A) Do you think this is the correct graph of the equation? Why or why not?
(B) Add points on the graph for x = –2, –1.5, –0.5, 0.5, 1.5, and 2.
(C) Now, what do you think the graph looks like? Sketch your version of the graph, adding more points as necessary.
(D) Graph this equation on a graphing calculator and compare it with your graph from part (C).
Step by Step Answer:

This question has not been answered yet.
You can Ask your question!
Related Book For 

Finite Mathematics For Business Economics Life Sciences And Social Sciences
ISBN: 9780134862620
14th Edition
Authors: Raymond Barnett, Michael Ziegler, Karl Byleen, Christopher Stocker
Question Posted:
