

According to the graph above, in 1970 the number of violent crimes per 100,000 capita in the
Question:
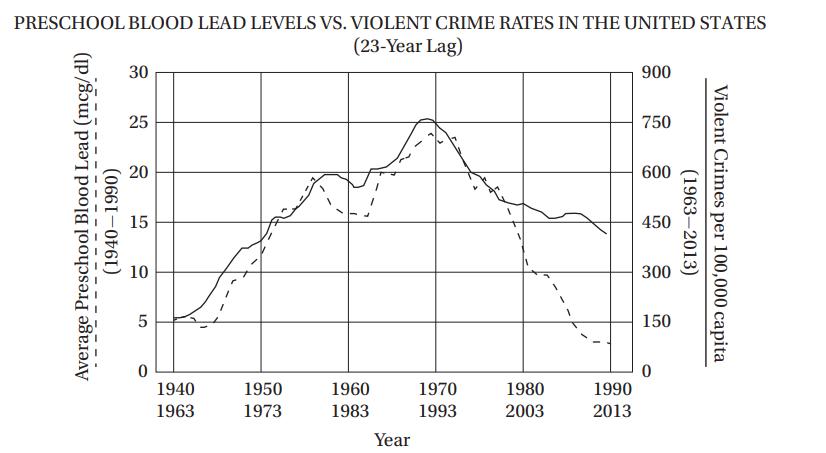
According to the graph above, in 1970 the number of violent crimes per 100,000 capita in the United States was closest to
A) 25
B) 375
C) 700
D) 750
Fantastic news! We've Found the answer you've been seeking!
Step by Step Answer:
B The vertical axis label on the left shows that the ...View the full answer

Answered By
Ali Khawaja
my expertise are as follows: financial accounting : - journal entries - financial statements including balance sheet, profit & loss account, cash flow statement & statement of changes in equity -consolidated statement of financial position. -ratio analysis -depreciation methods -accounting concepts -understanding and application of all international financial reporting standards (ifrs) -international accounting standards (ias) -etc business analysis : -business strategy -strategic choices -business processes -e-business -e-marketing -project management -finance -hrm financial management : -project appraisal -capital budgeting -net present value (npv) -internal rate of return (irr) -net present value(npv) -payback period -strategic position -strategic choices -information technology -project management -finance -human resource management auditing: -internal audit -external audit -substantive procedures -analytic procedures -designing and assessment of internal controls -developing the flow charts & data flow diagrams -audit reports -engagement letter -materiality economics: -micro -macro -game theory -econometric -mathematical application in economics -empirical macroeconomics -international trade -international political economy -monetary theory and policy -public economics ,business law, and all regarding commerce
1+ Reviews
10+ Question Solved
Related Book For 

McGraw-Hill Education SAT 2017
ISBN: 9781259641657
1st Edition
Authors: Christopher Black, Mark Anestis
Question Posted:
