

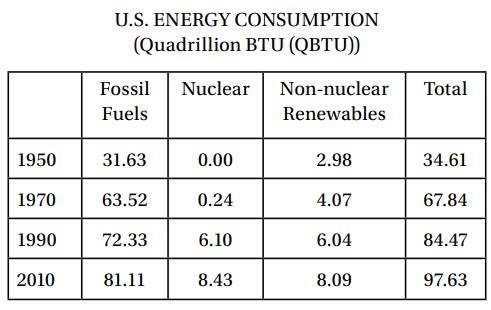
In a pie graph representing total U.S. energy consumption in 2010, the sector representing non nuclear renewables
Question:
In a pie graph representing total U.S. energy consumption in 2010, the sector representing non nuclear renewables would have a central angle measuring approximately
A) 8°
B) 12°
C) 24°
D) 30°
Fantastic news! We've Found the answer you've been seeking!
Step by Step Answer:
D In 2010 non nuclear renew...View the full answer

Answered By
Lisper Wanja
I am an experienced and highly motivated writer with a passion for the skills listed. I have a proven track record of my expertise and my aim is to deliver quality, well-detailed and plagiarism free projects. My genuine passion for writing combined with my ongoing professional development through school and research makes me an ideal candidate within for any assignment.
233+ Reviews
388+ Question Solved
Related Book For 

McGraw-Hill Education SAT 2017
ISBN: 9781259641657
1st Edition
Authors: Christopher Black, Mark Anestis
Question Posted:
