

The bar graph below displays the data gathered when individuals were polled about their favorite type of
Question:
The bar graph below displays the data gathered when individuals were polled about their favorite type of movie. Each person polled chose one movie type.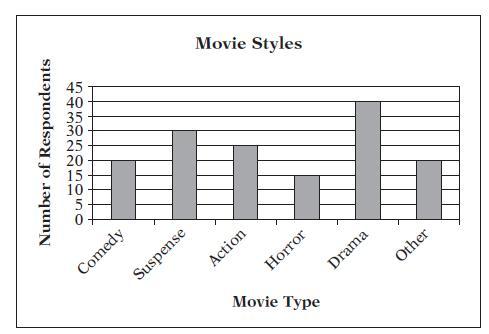
What is the ratio of Drama to Suspense?
A. 3:4
B. 4:3
C. 3:5
D. 5:3
E. 2:3
Fantastic news! We've Found the answer you've been seeking!
Step by Step Answer:
B Find the number of peopl...View the full answer

Answered By
Patrick Busaka
I am a result oriented and motivated person with passion for challenges because they provide me an opportunity to grow professionally.
38+ Reviews
58+ Question Solved
Related Book For 
McGraw Hills Conquering SAT Math
ISBN: 9780071493413
2nd Edition
Authors: Robert Postman, Ryan Postman
Question Posted:
