

The scatter plot below shows the relationship between the weight of a car and average miles per
Question:
The scatter plot below shows the relationship between the weight of a car and average miles per gallon of the car. Which of the following accurately describes the relationship?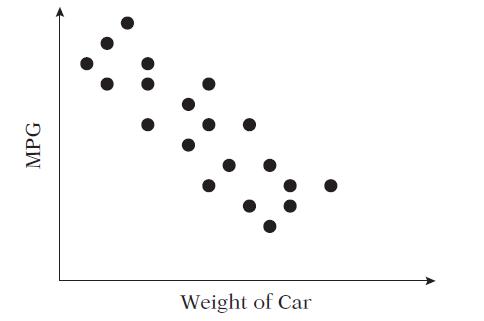
A. As the weight of the car increases the miles per gallon increase.
B. As the weight of the car increases the miles per gallon decrease.
C. As the weight of the car increases the miles per gallon does not change.
D. As the weight of the car decreases the miles per gallon decrease.
E. As the weight of the car decreases the miles per gallon does not change.
Fantastic news! We've Found the answer you've been seeking!
Step by Step Answer:
B You can see from the gra...View the full answer

Answered By
Sufiyan Ahmed Tariq
I am a Chartered Accountant and an Associate Public & Finance Accountant. I also hold a bachelors of Commerce degree. I have over 8 years of experience in accounting, finance and auditing. Through out my career, I have worked with many leading multinational organisation.
I have helped a number of students in studies by teaching them key concepts of subjects like accounting, finance, corporate law and auditing. I help students understanding the complex situation by providing them daily life examples.
I can help you in the following subject / areas:
a) Accounting;
b) Finance;
c) Commerce;
d) Auditing; and
e) Corporate Law.
7+ Reviews
17+ Question Solved
Related Book For 
McGraw Hills Conquering SAT Math
ISBN: 9780071493413
2nd Edition
Authors: Robert Postman, Ryan Postman
Question Posted:
