

Using MATLAB, plot the response of a viscously damped spring-mass system subject to the rectangular pulse shown
Question:
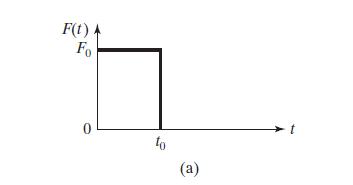
Using MATLAB, plot the response of a viscously damped spring-mass system subject to the rectangular pulse shown in Fig. 4.12 (a) with (a) \(t_{0}=0.1 \mathrm{~s}\) and (b) \(t_{0}=1.5 \mathrm{~s}\). Assume the following data: \(m=100 \mathrm{~kg}, k=1200 \mathrm{~N} / \mathrm{m}, c=50 \mathrm{~N}-\mathrm{s} / \mathrm{m}, F_{0}=100 \mathrm{~N}\).
Figure 4.12(a):-
Step by Step Answer:

This question has not been answered yet.
You can Ask your question!
Related Book For 

Question Posted:
