The accompanying table contains data on the U.S. economy for the years 1983 and 2019. The second
Question:
The accompanying table contains data on the U.S. economy for the years 1983 and 2019. The second column shows the poverty threshold. The third column shows the consumer price index (CPI), a measure of the overall level of prices.
And the fourth column shows U.S. gross domestic product
(GDP) per capita, a measure of the standard of living.
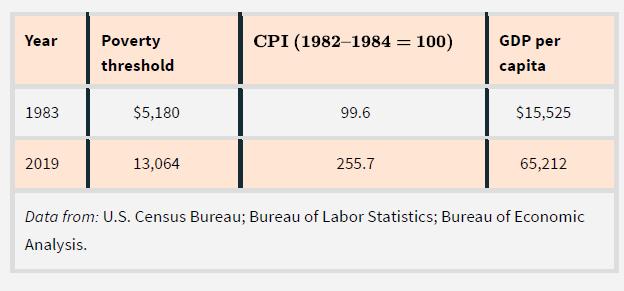
a. By what factor has the poverty threshold increased from 1983 to 2019? That is, has it doubled, tripled, and so on?
b. By what factor has the CPI increased from 1983 to 2019?
That is, has it doubled, tripled, and so on?
c. By what factor has GDP per capita increased from 1983 to 2019? That is, has it doubled, tripled, and so on?
d. What do your results tell you about how people officially classified as “poor” have done economically relative to other U.S. citizens?
Step by Step Answer: