

Investigate how demand elasticities are affected by increases in demand. Shift each of the demand curves in
Question:
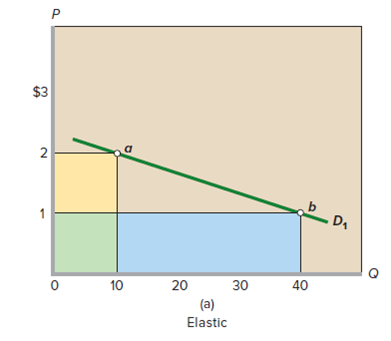
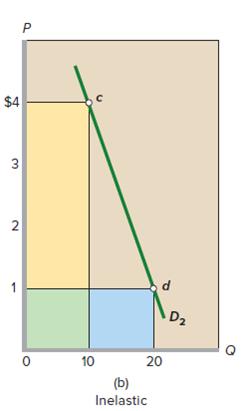
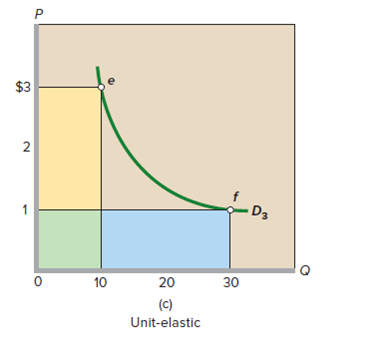
Investigate how demand elasticities are affected by increases in demand. Shift each of the demand curves in Figures 6.2a, 6.2b, and 6.2c to the right by 10 units. For example, point a in Figure 6.2a would shift rightward from location (10 units, $2) to (20 units, $2) while point b would shift rightward from location (40 units, $1) to (50 units, $1). After making these shifts, apply the midpoint formula to calculate the demand elasticities for the shifted points. Are they larger or smaller than the elasticities you calculated in Problem 1 for the original points? In terms of the midpoint formula, what explains the change in elasticities?
FIGURE 6.2 The total-revenue test for price elasticity. (a) Price declines from $2 to $1, and total revenue increases from $20 to $40. So demand is elastic. The gain in revenue (blue area) exceeds the loss of revenue (yellow area). (b) Price declines from $4 to $1, and total revenue falls from $40 to $20. So, demand is inelastic. The gain in revenue (blue area) is less than the loss of revenue (yellow area). (c) Price declines from $3 to $1, and total revenue does not change. Demand is unit-elastic. The gain in revenue (blue area) equals the loss of revenue (yellow area).
Step by Step Answer:
129 13 3333 23 6667 smaller everything in the midpoint formula stays the same except the referenc...View the full answer


Microeconomics Principles, Problems and Policies
ISBN: 978-1259450242
20th edition
Authors: Campbell R. McConnell, Stanley L. Brue, Sean Masaki Flynn
