

The graph below illustrates production isoquants for various levels of labor and capital. In the graph, supply
Question:
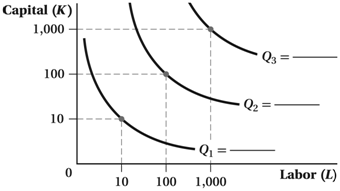
The graph below illustrates production isoquants for various levels of labor and capital. In the graph, supply the quantities Q1,?Q2, and?Q3 so that the production function displays
a. Increasing returns to scale
b. Decreasing returns to scale
c. Constant returns to scale
Fantastic news! We've Found the answer you've been seeking!
Step by Step Answer:
a As we move from the identified point on each isoquant to the identified point on the next hi...View the full answer

Answered By
Utsab mitra
I have the expertise to deliver these subjects to college and higher-level students. The services would involve only solving assignments, homework help, and others.
I have experience in delivering these subjects for the last 6 years on a freelancing basis in different companies around the globe. I am CMA certified and CGMA UK. I have professional experience of 18 years in the industry involved in the manufacturing company and IT implementation experience of over 12 years.
I have delivered this help to students effortlessly, which is essential to give the students a good grade in their studies.
2+ Reviews
10+ Question Solved
Related Book For 

Microeconomics
ISBN: 9781319105563
3rd Edition
Authors: Austan Goolsbee, Steven Levitt, Chad Syverson
Question Posted:
