

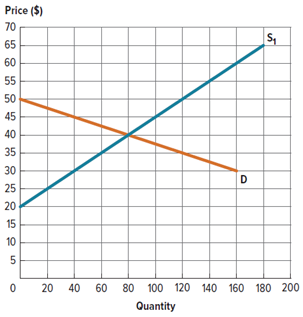
The market shown in Figure 6P-10 is in equilibrium. Suppose there is a $15 per unit subsidy
Question:
a. Draw the after-subsidy supply curve.
b. Plot the after-subsidy price paid by consumers and the after-subsidy price paid by sellers.
Figure 6P-10:
Fantastic news! We've Found the answer you've been seeking!
Step by Step Answer:
a b Each unit of the good is now 15 cheaper to produce and sell Thus the suppl...View the full answer

Answered By
Cristine kanyaa
I possess exceptional research and essay writing skills. I have successfully completed over 5000 projects and the responses are positively overwhelming . I have experience in handling Coursework, Session Long Papers, Manuscripts, Term papers, & Presentations among others. I have access to both physical and online library. this makes me a suitable candidate to tutor clients as I have adequate materials to carry out intensive research.
1538+ Reviews
3254+ Question Solved
Related Book For 
Question Posted:
