

a) In Figure 7, if the supply curve is S 1 , how much are equilibrium price
Question:
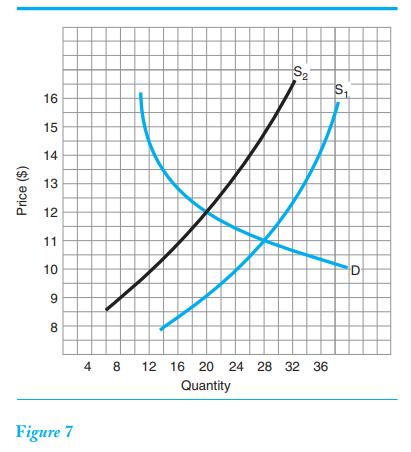
a) In Figure 7, if the supply curve is S1 , how much are equilibrium price and quantity? b) If the supply changes from S1 to S2 , does that represent an increase or decrease in supply? c) How much are the new equilibrium price and quantity?
Fantastic news! We've Found the answer you've been seeking!
Step by Step Answer:

Answered By
Nazrin Ziad
I am a post graduate in Zoology with specialization in Entomology.I also have a Bachelor degree in Education.I posess more than 10 years of teaching as well as tutoring experience.I have done a project on histopathological analysis on alcohol treated liver of Albino Mice.
I can deal with every field under Biology from basic to advanced level.I can also guide you for your project works related to biological subjects other than tutoring.You can also seek my help for cracking competitive exams with biology as one of the subjects.
2+ Reviews
10+ Question Solved
Related Book For 
Question Posted:
