

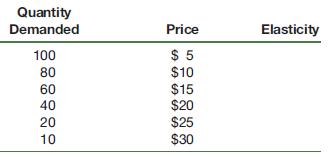
Plot the price and quantity data given in the demand schedule of exercise 1. Data from exercise
Question:
Plot the price and quantity data given in the demand schedule of exercise 1.
Data from exercise 1
a. Determine the price elasticity of demand at each quantity demanded using the arc or midpoint formula: Percentage change in quantity demanded = (Q2 - Q1)/Q1 divided by percentage change in price = (P2 - P1)/P1.
b. Redo exercise 1a using price changes of \($10\) rather than \($5\).
Put price on the vertical axis and quantity on the horizontal axis. Indicate the price elasticity value at each quantity demanded. Explain why the elasticity value gets smaller as you move down the demand curve.
Use the following hypothetical demand schedule for movies
Step by Step Answer:

This question has not been answered yet.
You can Ask your question!
Related Book For 

Question Posted:
