Use Figure 13 to show an increase in demand and an increase in supply. (a) Label each
Question:
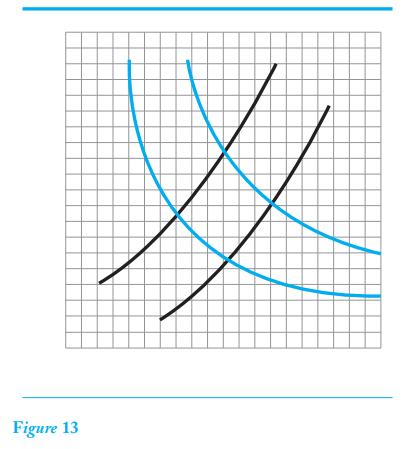
Use Figure 13 to show an increase in demand and an increase in supply. (a) Label each of the curves (S 1 , S 2 , D 1 , and D2 ). (b) State the original equilibrium price and quantity (c) State the new equilibrium price and quantity.
Transcribed Image Text:
Figure 13
Fantastic news! We've Found the answer you've been seeking!
Step by Step Answer:
Answer rating: 100% (QA)
Answered By
Parvesh Kumar
I am an experienced Mathematics and Statistics tutor with 10 years of experience teaching students and working professionals. I love teaching students who are passionate to learn subjects or wants to understand any mathematics and statistics concept at graduation or master’s level. I have worked with thousands of students in my teaching career. I have helped students deal with difficult topics and subjects like Calculus, Algebra, Discrete Mathematics, Complex analysis, Graph theory, Hypothesis testing, Probability, Statistical Inference and more. After learning from me, students have found Mathematics and Statistics not dull but a fun subject. I can handle almost all curriculum of mathematics. I did B.Sc (mathematics), M.Sc (mathematics), M.Tech (IT) and am also Gate (CS) qualified. I have worked in various college and school and also provided online tutoring to American and Canadian students. I look forward to discussing with you and make learning a meaningful and purposeful
5.00+
4+ Reviews
10+ Question Solved
Related Book For
Question Posted:
Students also viewed these Business questions
-
Use Figure 14 to show an increase in demand and a decrease in supply. (a) Label each of the curves (S 1 , S 2 , D 1 , and D 2 ). (b) State the original equilibrium price and quantity. (c) State the...
-
Using the figures below, answer the following questions: a. On the Demand panel: ¢ Show an increase in demand and label it D1. ¢ Show a decrease in demand and label it D2. ¢ Show an...
-
Tea is a popular beverage in many parts of the world, especially during rainy seasons. This is because tea, having curative properties like flavonoids and polyphenols for typical ailments like...
-
1. Consider a local department store which only sells jeans (J) and sweaters (S). Jeans cost $20 and sweaters cost $30. For each of the examples below, graph the budget constraint our consumer faces,...
-
Refer to Steele's financial statements in Exercise 12-76 and the information below. At January 1, 2018, total stockholders equity was $2,083,122 and there was no preferred stock. Required: 1. Compute...
-
At what speed will the momentum of a proton (mass 1 u) equal that of an alpha particle (mass 4 u) moving at 0.5c?
-
Given the feed streams and the parameters of the process units as shown in Figure 7.39, complete the simulation flowsheet for ASPEN PLUS and show the calculation sequence (i.e., complete the...
-
Nabb & Fry Co. reports net income of $31,000. Interest allowances are Nabb $7,000 and Fry $5,000; salary allowances are Nabb $15,000 and Fry $10,000; the remainder is shared equally. Show the...
-
On May 1, Soriano Company reported the following account balances along with their estimated fair values: Receivables Inventory Copyrights Account Patented technology Total assets Current liabilities...
-
Without drawing a graph, estimate equilibrium price and quantity using the information given in Table 3. TABLE 3 Price $40 20 Quantity Demanded 4 60 Quantity Supplied 100 25
-
(a) Using Figure 12, draw a new demand curve, D 2 , which illustrates a decrease in demand. (b) State what happens to equilibrium price and quantity. Price ($) Figure 12 Quantity
-
Choose an industry and identify the factors that will determine its performance in the next 3 years. What is your forecast for performance in that time period?
-
Explain using graphs the concept of an optimal export tax. Show the optimal export tax for a large exporting country and how it will affect world trade, world price, and the gains from trade for the...
-
Identify the element and descriptor from the National Quality Standard (NQS) that relates most closely to Education and Care Services National Law Section 168 , which is reflected in Regulation 73 .
-
The following information relates to Tabita Ltd. The financial year ended on 28 February 2023. REQUIRED: 1.1 Refer to Information B. Calculate the missing amounts denoted by (a) to (e).
-
How would you make the safety data sheets (SDSs) available to employees, and what procedures would you use to evaluate the effectiveness of the program?
-
We have seen economic and structural work changes from the 20th century through today that have impacted workers profoundly. In light of these changes, what are workers experiencing in terms of...
-
Is Facebook just a passing fad or is it here to stay? What are the companys greatest strengths and risks?
-
Grace is training to be an airplane pilot and must complete five days of flying training in October with at least one day of rest between trainings. How many ways can Grace schedule her flying...
-
Assume a firm is a monopsonist that can hire its first worker for $6 but must increase the wage rate by $3 to attract each successive worker. Draw the firms labor supply and marginal resource cost...
-
What is meant by investment in human capital? Use this concept to explain (a) Wage differentials (b) The long-run rise of real wage rates in the United States.
-
Which industries and occupations have the highest rates of unionization? Which the lowest? Speculate on the reasons for such large differences.
-
What did you divide the debt (1,000) by in order to get 6.3% as your cost of debt?
-
Some benefits and costs cannot be quantified . Explain them. What kinds of benefits and costs elude quantification, and how can these be factored into an investment decision?
-
MEMORNDUM TO: Bill Bugnay FROM: M. Lasker Please make the GST Remittances (normally monthly) to the Receiver General for November (#2147) now as we will be closed until January 5, 20XX + 1. For...
Study smarter with the SolutionInn App