

After the earthquake that triggered the catastrophic failure of the Fukushima-Daiichi nuclear power plant on March 11,
Question:
After the earthquake that triggered the catastrophic failure of the Fukushima-Daiichi nuclear power plant on March 11, 2011, reactor operation was immediately stopped. However, the subsequent tsunami disabled the cooling system needed to remove the decay heat, which was still being generated. This system failure led to a meltdown of three reactors and escape of radioactive material.
The boiling water reactors that were in use each generated ∼500MW of heat, under normal operation, and the decay-heat production amounted to ∼30MW. Suppose that this decay heat was being carried off equally by a large number of cylindrical pipes of length L ∼ 10m and inner radius R ∼ 10 mm, taking it from the reactor core, where the water temperature was T0 ∼ 550 K and the pressure was P0 ∼ 107 Nm−2, to a heat exchanger. Suppose, initially, that the flow was laminar, so that the fluid velocity had the parabolic Poiseuille profile:
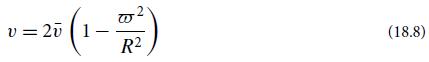
[Eq. (13.80) and associated discussion]. Here, ω̅ is the cylindrical radial coordinate measured from the axis of the pipe, and v̅ is the mean speed along the pipe. As the goal was to carry the heat away efficiently during normal operation, the pipe was thermally well insulated, so its inner wall was at nearly the same temperature as the core of
the fluid (at ω̅ = 0). The total temperature drop △T down the length L was then △T ≪ △T0, and the longitudinal temperature gradient was constant, so the temperature distribution in the pipe had the form:
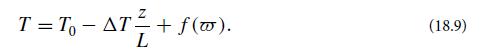
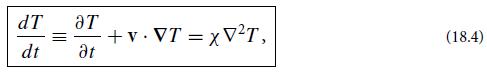
(a) Use Eq. (18.4) to show that
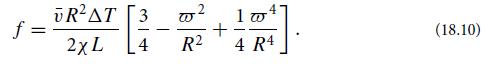
(b) Derive an expression for the conductive heat flux through the walls of the pipe and show that the ratio of the heat escaping through the walls to that advected by the fluid was △T/T . (Ignore the influence of the temperature gradient on the velocity field, and treat the thermal diffusivity and specific heat as constant throughout the flow.)
![]()
the critical value for transition to turbulence. Show that the maximum power that could be carried by a laminar flow was:
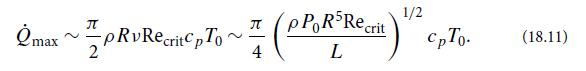
Estimate the mean velocity v̅, the temperature drop △T, and the number of cooling pipes needed in normal operation, when the flow was about to transition to turbulence. Assume that χ = 10−7 m2 s−1, cp = 6 kJ kg−1 K−1, and ρν = η = 1× 10⁻⁴ Pa s−1.
(d) Describe qualitatively what would happen if the flow became turbulent (as it did under normal operation).
Eq. (18.4)
Step by Step Answer:


Modern Classical Physics Optics Fluids Plasmas Elasticity Relativity And Statistical Physics
ISBN: 9780691159027
1st Edition
Authors: Kip S. Thorne, Roger D. Blandford
