

1. Construct a cumulative frequency table of the plant height data in Table 10.5 and draw a...
Question:
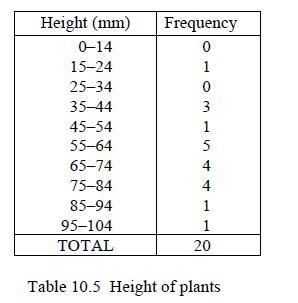
1. Construct a cumulative frequency table of the plant height data in Table 10.5 and draw a cumulative graph. Determine the lower quartile, upper quartile, median and inter-quartile range of the data.
2. The pre-names of pupils in a class were:
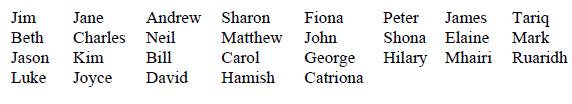
(a) Draw up a tally chart for the lengths of the names of the pupils and from it construct
(i) A bar chart
(ii) Dot plot to represent the data
(b) Calculate the mean and median of the data set and find its inter-quartile range.
(c) Estimate the mode of the data using the approximation
![]()
Fantastic news! We've Found the answer you've been seeking!
Step by Step Answer:
1 2 014 1524 2534 3544 ...View the full answer

Answered By
Lilian Nyambura
Hi, am Lilian Nyambura, With extensive experience in the writing industry, I am the best fit for your writing projects. I am currently pursuing a B.A. in Business Administration. With over 5 years of experience, I can comfortably say I am good in article writing, editing and proofreading, academic writing, resumes and cover letters. I have good command over English grammar, English Basic Skills, English Spelling, English Vocabulary, U.S. English Sentence Structure, U.K. or U.S. English Punctuation and other grammar related topics. Let me help you with all your essays, assignments, projects, dissertations, online exams and other related tasks. Quality is my goal.
378+ Reviews
750+ Question Solved
Related Book For 

Question Posted:
