

Figures for a wells daily production of oil in barrels are as follows: Construct a stem-and-leaf plot
Question:
Figures for a well’s daily production of oil in barrels are as follows:
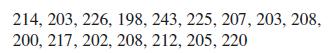
Construct a stem-and-leaf plot with stem labels 19*, 20*, . . . ., 24*.
Fantastic news! We've Found the answer you've been seeking!
Step by Step Answer:
19 8 20 ...View the full answer

Answered By
GERALD KAMAU
non-plagiarism work, timely work and A++ work
6+ Reviews
11+ Question Solved
Related Book For 

Question Posted:
