

An article in the Amer. J. Enol. and Viti. (2006: 486490) includes the following alcohol content measurements
Question:
An article in the Amer. J. Enol. and Viti. (2006: 486–490) includes the following alcohol content measurements (%) for a sample of n = 35 port wines.
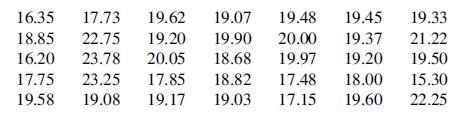
a. Graph the data. Based on the graph, what is a representative value for the alcohol content in port wines?
b. Calculate the mean and the median. Are these values consistent with your answer in (a)? Why or why not?
Step by Step Answer:

This question has not been answered yet.
You can Ask your question!
Related Book For 

Modern Mathematical Statistics With Applications
ISBN: 9783030551551
3rd Edition
Authors: Jay L. Devore, Kenneth N. Berk, Matthew A. Carlton
Question Posted:
