

Recall the scenario from Example 10.8 about the experiment in the low-level college mathematics course. Here are
Question:
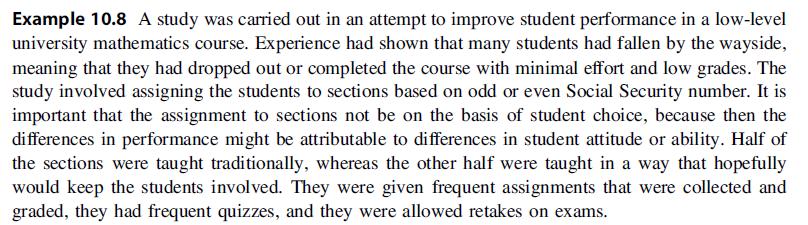
Recall the scenario from Example 10.8 about the experiment in the low-level college mathematics course. Here are the 85 final exam scores for those in the experimental group (E) and the 79 final exam scores for those in the control group (C):
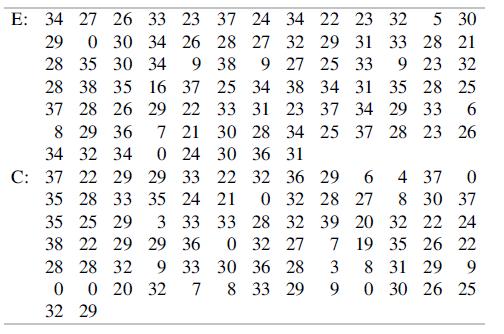
a. Determine a 95% confidence interval for the difference of population means using a two-sample t interval.
b. Use software to generate a bootstrap sample of differences of means. Check the bootstrap distribution for normality using a normal probability plot.
c. Use the standard deviation of the bootstrap distribution along with the mean and t critical value from (a) to get a 95% confidence interval for the difference of means.
d. Use the bootstrap sample and the percentile method to obtain a 95% confidence interval for the difference of means.
e. Compare your three confidence intervals. If they are very similar, why do you think this is the case? In the light of your results for (c) and (d), does the two-sample t interval of (a) seem to work, regardless of normality? Explain.
f. Are your results consistent with the results of Example 10.8? Explain.
Example 10.8
Step by Step Answer:

This question has not been answered yet.
You can Ask your question!

Modern Mathematical Statistics With Applications
ISBN: 9783030551551
3rd Edition
Authors: Jay L. Devore, Kenneth N. Berk, Matthew A. Carlton
