

The 33 children were each observed in about 100 ten-second intervals in the first grade, and again
Question:
The 33 children were each observed in about 100 ten-second intervals in the first grade, and again in the second and third grades. Because private speech occurs more in challenging circumstances, the children were observed while doing their mathematics. The speech was classified as on task (about the math lesson), off task, or mumbling (the observer could not tell what was said). Here are the 33 first-grade mumble scores, followed by the third grade scores:
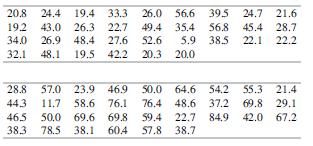
The numbers are in the same order for each grade; for example, the third student mumbled in 19.4% of the intervals in the first grade and 23.9% of the intervals in the third grade.
a. Verify graphically that normality is plausible for the population distribution of differences.
b. Find a 95% confidence interval for the difference of population means, and interpret the result.
Step by Step Answer:


Modern Mathematical Statistics With Applications
ISBN: 9783030551551
3rd Edition
Authors: Jay L. Devore, Kenneth N. Berk, Matthew A. Carlton
