

The accompanying data on x = true density (kg/mm 3 ) and y = moisture content (%
Question:
The accompanying data on x = true density (kg/mm3) and y = moisture content (% d. b.) was read from a plot in the article “Physical Properties of Cumin Seed” (J. Agric. Engr. Res. 1996: 93–98).
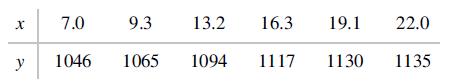
The equation of the least squares line is y = 1008.14 + 6.19268x (this differs very slightly from the equation given in the article); se = 7.265 and R2 = .968.
a. Carry out a test of model utility and comment.
b. Compute the values of the residuals and plot the residuals against x. Does the plot suggest that a linear regression function is inappropriate?
c. Compute the values of the standardized residuals and plot them against x. Are there any unusually large (positive or negative) standardized residuals? Does this plot give the same message as the plot of part (b) regarding the appropriateness of a linear regression function?
Step by Step Answer:

This question has not been answered yet.
You can Ask your question!

Modern Mathematical Statistics With Applications
ISBN: 9783030551551
3rd Edition
Authors: Jay L. Devore, Kenneth N. Berk, Matthew A. Carlton
