

Table 3.10 shows the supply and demand for movie tickets in a city. Graph demand and supply
Question:
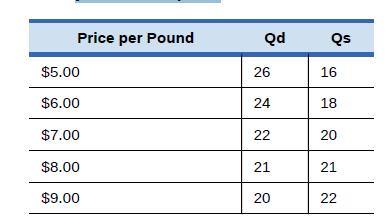
Table 3.10 shows the supply and demand for movie tickets in a city. Graph demand and supply and identify the equilibrium. Then calculate in a table and graph the effect of the following two changes.
a. Three new nightclubs open. They offer decent bands and have no cover charge, but make their money by selling food and drink. As a result, demand for movie tickets falls by six units at every price.
b. The city eliminates a tax that it placed on all local entertainment businesses. The result is that the quantity supplied of movies at any given price increases by 10%.
Table 3.10
Fantastic news! We've Found the answer you've been seeking!
Step by Step Answer:
lets start by graphing the demand and supply curves using the data provided in Table 310 and identif...View the full answer

Answered By
Rashul Chutani
I have been associated with the area of Computer Science for long. At my university, I have taught students various Computer Science Courses like Data Structures, Algorithms, Theory of Computation, Digital Logic, System Design, and Machine Learning. I also write answers to questions posted by students in the area of and around Computer Science.
I am highly fortunate to receive great feedback on my teaching skills that keeps me motivated. Once a student sent me an email stating that I had explained to him a concept better than his professor did.
I believe in the fact that "Teaching is the best way to learn". I am highly fascinated by the way technology nowadays is solving real-world problems and try to contribute my bit to the same.
Besides tutoring, I am a researcher at the Indian Institute of Technology. My present works are in the area of Text Summarization and Signal and Systems.
Some of my achievements include clearing JEE Advanced with an All India Rank of 306 out of 1.5 million contesting candidates and being the Department Ranker 1 at my University in the Department of Computer Science and Engineering.
I look forward to providing the best Tutoring Experience I can, to the student I teach.
1+ Reviews
10+ Question Solved
Related Book For 
Question Posted:
