Use a money market graph to show the effect of an open market purchase of U.S. Treasury
Question:
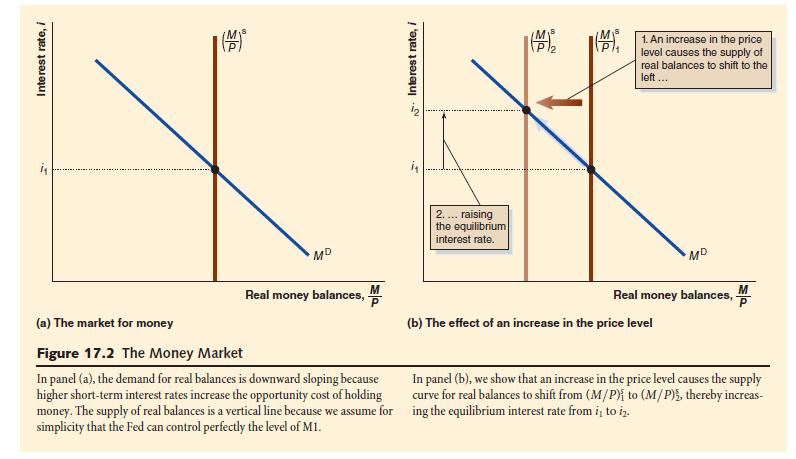
Use a money market graph to show the effect of an open market purchase of U.S. Treasury securities by the Federal Reserve. Use the results from your graph to explain why the aggregate demand curve shifts when the Fed purchases Treasury securities.
Transcribed Image Text:
Interest rate, i MD Real money balances, M i Interest rate, i 2.... raising the equilibrium interest rate. MY 1. An increase in the price level causes the supply of real balances to shift to the left... MD Real money balances, P M (a) The market for money Figure 17.2 The Money Market In panel (a), the demand for real balances is downward sloping because higher short-term interest rates increase the opportunity cost of holding money. The supply of real balances is a vertical line because we assume for simplicity that the Fed can control perfectly the level of M1. (b) The effect of an increase in the price level In panel (b), we show that an increase in the price level causes the supply curve for real balances to shift from (M/P) to (M/P), thereby increas- ing the equilibrium interest rate from i to i.
Step by Step Answer:

This question has not been answered yet.
You can Ask your question!
Related Book For 

Money Banking And The Financial System International Edition
ISBN: 978-1292000183
2nd Edition
Authors: R. Glenn Hubbard ,Anthony P Obrien
Question Posted:
Students also viewed these Business questions
-
In 2008 and 2009, the US economy and many others around the world experienced a financial crisis and a severe downturn in economic activty. In many ways, it was the worst macroeconomic event in more...
-
QUESTION 16 Imagine you live in a country with huge public debt and an uncertain future. Monetization of this public debt is most likely to lead to which of these outcomes? a.Inflation b.Stagflation...
-
This section contains 6 questions. Questions 83 to 88 have four statements (A, B C and D) given in Column I and four statements (p, q, r and s) in Column II. Any given statement in Column I can have...
-
SpeedPrint manufactures and sells 18,000 high-technology printing presses each year. The variable and fixed costs of rework and repair are as follows: SpeedPrint's current presses have a quality...
-
Increased substitution around a bond leads to increased strain. Take the four substituted butanes listed below, for example. For each compound, sight along the C2-C3 bond and draw Newman projections...
-
What are some of the nonverbal clues to deception?
-
Assume that your firm, Daulton & Weed, CPAs, has been approached by a Tempest, a golf ball manufacturer to attest to the average drive distance that Tempests new GOFAR ball can be driven. Tempest has...
-
1. Tony stark is trying to talk pepper Potts into attending an event with him. Pepper does not want to attend because she feels that she and will be much older than most of the younger crowd...
-
An article in the Economist magazine observed: Creating more inflation is harder than it sounds. . . . It requires aggregate demand to return to, and exceed, potential output. Use an ADAS graph to...
-
What is the misperception theory? What does it explain?
-
A not-for-profit museum receives a painting by Monet valued at $750,000. The museum chose not to report the painting on its financial statements. What are the rules for such reporting?
-
"When management thinks they are having enough revenues, their business is overall successful, they offer what their customer wants and most of all when they perceive quality and auditing as just an...
-
What the guidelines in each of the two codes that relate to working with families?
-
Resource Management for "TechTrends Inc." This innovative startup had a bold vision - to transform the tech accessories market by creating a cutting-edge e-commerce website. This website would not...
-
Capital Structure Ratios Liquidity Ratios Benchmark Horizontal Analysis Activity Ratios Vertical analysis Ratio Profitability Ratios 1. Desired level of performance used to evaluate performance. 2....
-
Supply Chain Operation's Activitiesin healthcarecan be defined as the management of flow of consumables and services, which begins from the origin of consumable item and ends at the consumables'...
-
The weight and systolic blood pressure of 26 randomly selected males in the age group 25 to 30 are shown in the following table. Assume that weight and blood pressure are jointly normally...
-
Carlton Stokes owns and operates a car-detailing business named SuperShine & Detailing. For $150, Carltons business will hand wash and wax customers cars, vacuum the interior, and thoroughly clean...
-
Monetization of public debt often leads to which economic problem? a. Inflation b. Unemployment c. Stock market asset bubbles d. Falling commodity prices
-
The European Central Bank uses reserve transactions in its version of open market operations. Explain to someone with no training in economics what reserve transactions are.
-
Explain how the European Central Banks interest payments on the deposits commercial banks have at the ECB provides an interest rate floor for the interbank lending rate.
-
What elements of the operations strategy would need to be adjusted in order to accommodate the proposed Desron opportunity? How would these translated into a set of operations performance objectives?
-
Creating structure in any organization is essential for success. An implementation structure for innovation is no different. In this two-part assignment, you will organizational structure for...
-
What role do regulatory frameworks, industry standards, and international conventions play in promoting integrity and combating corruption, money laundering, and unethical business practices on a...

Study smarter with the SolutionInn App


