

Question: 1. The table shows after-tax income shares in Canada in 1986. a. What is after-tax income? b. Draw a Lorenz curve for Canada in 1986
1. The table shows after-tax income shares in Canada in 1986.
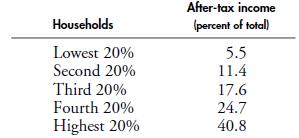
a. What is after-tax income?
b. Draw a Lorenz curve for Canada in 1986 and compare it with the Lorenz curve in 2006 shown in Fig. 19.3.
c. Was Canadian after-tax income distributed more equally or less equally in 2006 than it was in 1986?
d. What are some reasons for the differences in the distribution of after-tax income in Canada in 1986 and 2006?
Households After-tax income (percent of total) Lowest 20% 5.5 Second 20% 11.4 Third 20% 17.6 Fourth 20% 24.7 Highest 20% 40.8
Step by Step Solution
There are 3 Steps involved in it
1 Expert Approved Answer
Step: 1 Unlock

Question Has Been Solved by an Expert!
Get step-by-step solutions from verified subject matter experts
Step: 2 Unlock
Step: 3 Unlock