

The graph in Figure 14.32 shows the distribution of scores on an examination. Figure 14. 32 Which
Question:
The graph in Figure 14.32 shows the distribution of scores on an examination.
Figure 14.32
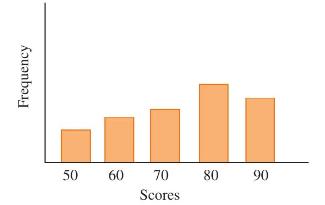
Which of the following statements is true about the distribution?
A. The mean is less than the mode.
B. The median is the same as the mode.
C. The median is greater than the mode.
D. The mean is the same as the mode.
Step by Step Answer:

This question has not been answered yet.
You can Ask your question!
Related Book For 

Question Posted:
