

Assume you have n+1 data points (x i , y i ), i = 0, . .
Question:
Assume you have n+1 data points (xi, yi), i = 0, . . . , n, where x is the independent variable and y is the dependent variable. You suspect that these data come from some unknown function of the form y = f(x). Since the function is unknown, you choose to construct an approximation to the function based on interpolating the data with polynomials. Typically the xi values are equispaced. In this problem, you will examine how well a polynomial interpolant based on equispaced data approximates a function. To do this, one way is to evaluate a known function at n + 1 points to get (xi, yi), interpolate through the points, and finally evaluate the interpolant as well as the original function at various points to check the error.
Consider the function![f(x) = 1 1+25x x = [-1, 1].](https://dsd5zvtm8ll6.cloudfront.net/si.question.images/images/question_images/1697/7/0/8/8206530fb145fc8b1697708818534.jpg)
Write a MATLAB program to do the following.
(a) Generate 500 equispaced points from [−1, 1] using the linspace command and store it in a vector x˜. Determine y˜, where y˜i = f (x˜i).
(b) For n = 5, 10, and 15:
(1) Generate n + 1 equispaced points from [−1, 1] and store it in a vector x. Evaluate y, where yi = f(xi). These are the points based on which you will interpolate. Your interpolant will be an nth degree polynomial.
(2) Determine the nth degree polynomial which interpolates through all pairs (xi, yi) using the Newton–Gregory method and evaluate it at all ˜xi, i = 1, . . . , 500. Store the evaluated results in a vector ˆy. What is important is the value of the polynomial at different points, so you do not need to explicitly state or print this polynomial.
(3) On the same graph, plot ˜y versus ˜x, y versus x, and ˆy versus ˜x. The original function is ˜y, its values at the interpolating points are given by y, and the values from your approximation to the function are given by ˆy.
Your program should not print anything to the screen. It should only generate the plots with appropriate titles. Here is one way to generate the plots: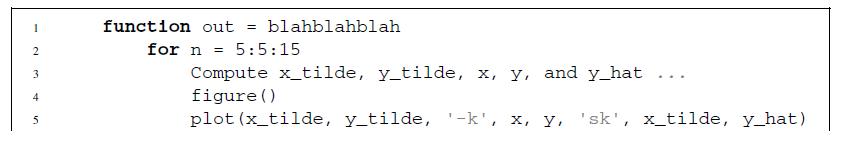
![6 7 00 O 8 9 end end legend ('ytilde', 'y', 'yhat') title(['Plot for n = ', num2str (n)])](https://dsd5zvtm8ll6.cloudfront.net/si.question.images/images/question_images/1697/7/0/9/0996530fc2bd50c91697709097476.jpg)
Step by Step Answer:

This question has not been answered yet.
You can Ask your question!

Numerical Methods With Chemical Engineering Applications
ISBN: 9781107135116
1st Edition
Authors: Kevin D. Dorfman, Prodromos Daoutidis
