

Breakthrough curves describe the concentration of the solution eluted from an adsorption column over time. The efficiency
Question:
Breakthrough curves describe the concentration of the solution eluted from an adsorption column over time. The efficiency of a column is calculated from breakthrough curves as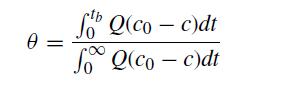
where Q is the volumetric flow rate, c0 is the original concentration, and tb is the breakthrough time, the time when the eluent concentration is no longer zero. Note that for an ideal adsorption column, the eluent concentration would be equal to the original at tb and would give an efficiency of 100%. In the case of a real column, let tb be the time when the concentration is 1% of the original, or c/c0 = 0.01.
Given the data in Table 8.8, write a MATLAB program to interpolate the data to the highest order, display the coefficients, and plot the data and polynomial together. Use the same program to use multiple trapezoid integration to calculate the efficiency to a reasonable accuracy. By hand, compute the efficiency by replacing the integration with right-hand sums and compare to your program output.
It would be best to split the integrals into two sections (before and after t = 12 h) for a better interpolation. The eluent concentration before t = 12 h is zero.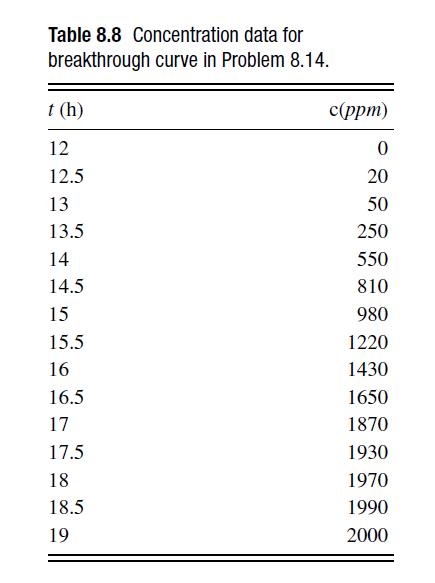
Step by Step Answer:

This question has not been answered yet.
You can Ask your question!

Numerical Methods With Chemical Engineering Applications
ISBN: 9781107135116
1st Edition
Authors: Kevin D. Dorfman, Prodromos Daoutidis
