

In this problem, we will analyze a dynamic model of the two-species CSTR bioreactor shown in Fig.
Question:
In this problem, we will analyze a dynamic model of the two-species CSTR bioreactor shown in Fig. 5.24. On the left, fresh media with a substrate concentration Sin enters at a volumetric flow rate Q. Inside the reactor volume V, bacteria at a concentration X consume the substrate at concentration S which allows them to multiply with a specific growth rate given by Monod kinetics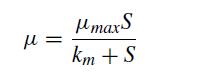
On the right of the diagram, bacteria, substrate, and water exit the bioreactor with flowrate Q.
A mass balance on X and S yields the following system of equations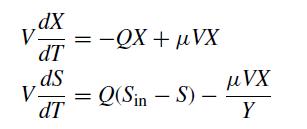
where T is time. Note the constant Y, which is the yield of biomass produced per substrate consumed. To simplify the mathematical problem we define dimensionless variables x = X/Sin, s = S/Sin, t = TQ/V. The non-dimensional equations are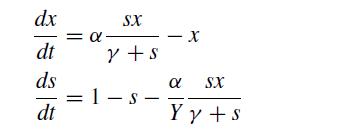
where the dimensionless parameters α = μmaxV/Q and γ = km/Sin appear. Note that to be physically meaningful x, s, and Y ∈ [0, 1] and t, α, and γ ∈ [0,∞).
(a) Perform a linear stability analysis of the dimensionless dynamic system when α = 2, Y = 1/2, and γ = 1/2. Do this in the following steps.
(1) Explain the physical meaning of the dimensionless parameters α and γ .
(2) Find the steady states of the dynamic system. What do these correspond to physically?
(3) Find the Jacobian before substituting the numerical values of the parameters.
(4) Find the eigenvalues of the Jacobian for each steady state. Are they stable states? What class of behavior do they show?
(b) Suppose you wish to innoculate the bioreactor with bacteria. You let the bioreactor run for a long time until S = Sin and then innoculate with enough microbes so that X = 0.05Sin. Use RK4 to find the trajectory that your innoculation takes in phase space. What happens if you are lazy and decide not to wait until the reactor reaches S = Sin before innoculating? Instead you innoculate when S = 0.3Sin, but you increase the innoculation concentration to X = 0.1Sin (just to be safe). Use RK4 to find this trajectory as well. In a few words explain what is physically happening as a function of time in each of the two trajectories. To get an idea of the entire phase space, plot the velocity field for x ∈ [0, 1] and s ∈ [0, 1]. As a hint, a velocity field may be plotted using the following MATLAB syntax. In the code example, f is a vector function that holds the “right-hand side” of the equation for the dynamical system.![1 2 3 4 5 6 7 20 [x, s] = meshgrid (linspace (0, 1), linspace(0, 1)); RHS = zeros (length(x), length(x), 2);](https://dsd5zvtm8ll6.cloudfront.net/si.question.images/images/question_images/1697/6/9/3/8406530c090612681697693836795.jpg)
Combine your trajectories and the points for the steady state solution (from part (a)) to the plot of the velocity field. You may find the MATLAB commands hold on and hold off useful for overlaying multiple functions in a plot.
(c) The steady states of the bioreactor are sensitive to the operation parameters, such as the flow rate. Changing the flow rate changes the dimensionless parameter α. Make a plot of both x and s for both steady states as α varies from 1 (high flow rate) to 2 (low flow rate). This type of behavior in your plot is an example of a phenomena called a transcritical bifurcation. Qualitatively answer the following questions regarding the plot you just made: What happens to the location of the steady states? Does the stability of the steady states change or stay the same as α changes? What makes the point α = γ + 1 special; what is physically happening here?
Step by Step Answer:

This question has not been answered yet.
You can Ask your question!

Numerical Methods With Chemical Engineering Applications
ISBN: 9781107135116
1st Edition
Authors: Kevin D. Dorfman, Prodromos Daoutidis
