

This problem set deals with the Schlgel model for a bistable biochemical reaction. You can read more
Question:
This problem set deals with the Schlögel model for a bistable biochemical reaction. You can read more about it in the paper “On thermodynamics near a steady state” (Z. Physik 248, 446–458, 1971). For our purposes, you can think of the model as being the solution to the ordinary differential equation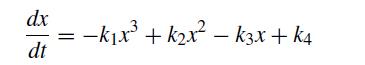
where x is the concentration of some species and the ki are the reaction rates. We’ll work with a particular choice of these parameters: k1 = 0.0015, k2 = 0.15, k3 = 3.5, and k4 = 20.
(a) Write a MATLAB program that determines the steady states for this system. For each steady state, you should make a linear stability analysis to determine if the steady state is stable or unstable. In this type of analysis, you consider a steady state xss and a small perturbation Δx around the steady state. You then derive a linear differential equation for Δx by ignoring terms involving Δx2 and higherorder powers. The solution of this equation tells you if the perturbation grows in time (unstable) or decays (stable). Provide the values of the steady states and their stability, along with a derivation of the stability condition.
(b) Write a MATLAB program that uses RK4 to integrate the differential equation until it reaches a value near one of the steady states. Your program should automatically generate a plot of x(t) for initial conditions x = 0, x = 15, x = 30, and x = 50. It may be helpful (but not required) to also have the steady states on your plot. While it is not required for part (b), it is best that you have your program automatically detect if you are near the steady state so that you can use it for part (c).
(c) Use your program from part (b) (with some changes, if necessary), to determine the value of the steady state xss corresponding to initial conditions x = 0, 1, . . ., 100. Your program should make plots of (i) the steady state concentration xss versus the initial concentration x0 and (ii) the time (i.e., the number of time steps multiplied by the step size) to get to some fixed distance from the steady state versus the initial concentration. Note that the time depends on the time step and what you consider “close” to the steady state, so choose reasonable values for both quantities. Explain the behavior in the plots.
Step by Step Answer:

This question has not been answered yet.
You can Ask your question!

Numerical Methods With Chemical Engineering Applications
ISBN: 9781107135116
1st Edition
Authors: Kevin D. Dorfman, Prodromos Daoutidis
