

In the early 1990's, researchers in the UK collected data on traffic flow, number of shoppers, and
Question:
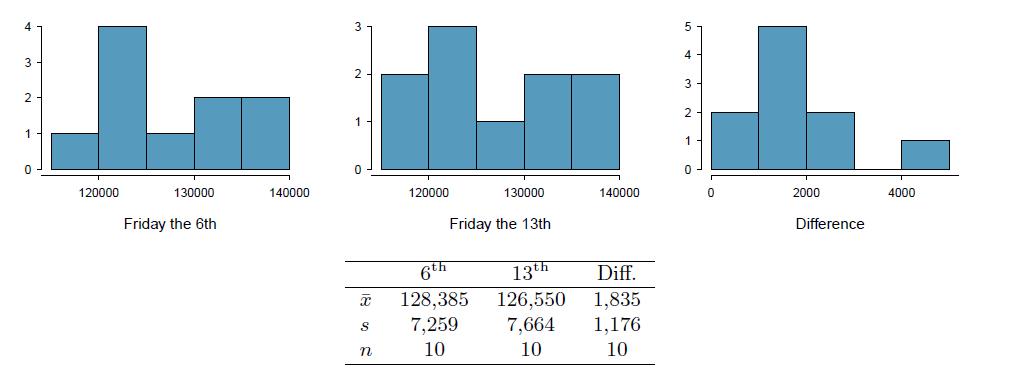
In the early 1990's, researchers in the UK collected data on traffic flow, number of shoppers, and traffic accident related emergency room admissions on Friday the 13th and the previous Friday, Friday the 6th. The histograms below show the distribution of number of cars passing by a specific intersection on Friday the 6th and Friday the 13th for many such date pairs. Also given are some sample statistics, where the difference is the number of cars on the 6th minus the number of cars on the 13th.
(a) Are there any underlying structures in these data that should be considered in an analysis? Explain.
(b) What are the hypotheses for evaluating whether the number of people out on Friday the 6th is different than the number out on Friday the 13th?
(c) Check conditions to carry out the hypothesis test from part (b).
(d) Calculate the test statistic and the p-value.
(e) What is the conclusion of the hypothesis test?
(f) Interpret the p-value in this context.
(g) What type of error might have been made in the conclusion of your test? Explain.
Step by Step Answer:


OpenIntro Statistics
ISBN: 9781943450077
4th Edition
Authors: David Diez, Mine Çetinkaya-Rundel, Christopher Barr
