

The scatterplot below shows the percent of families who own their home vs. the percent of the
Question:
The scatterplot below shows the percent of families who own their home vs. the percent of the population living in urban areas. There are 52 observations, each corresponding to a state in the US. Puerto Rico and District of Columbia are also included.
(a) Describe the relationship between the percent of families who own their home and the percent of the population living in urban areas.
(b) The outlier at the bottom right corner is District of Columbia, where 100% of the population is considered urban. What type of an outlier is this observation?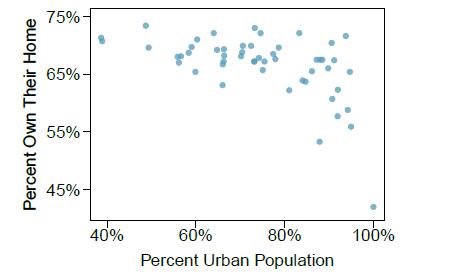
Fantastic news! We've Found the answer you've been seeking!
Step by Step Answer:
a From the scatterplot provided it is possible to describe the relationship between the percent of f...View the full answer

Answered By
Nyron Beeput
I am an active educator and professional tutor with substantial experience in Biology and General Science. The past two years I have been tutoring online intensively with high school and college students. I have been teaching for four years and this experience has helped me to hone skills such as patience, dedication and flexibility. I work at the pace of my students and ensure that they understand.
My method of using real life examples that my students can relate to has helped them grasp concepts more readily. I also help students learn how to apply their knowledge and they appreciate that very much.
1+ Reviews
10+ Question Solved
Related Book For 
OpenIntro Statistics
ISBN: 9781943450077
4th Edition
Authors: David Diez, Mine Çetinkaya-Rundel, Christopher Barr
Question Posted:
