

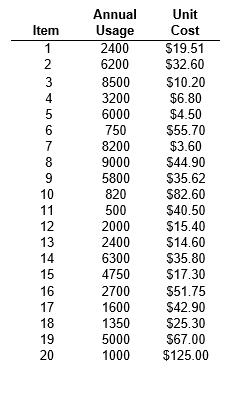
Perform an ABC analysis for the data provided in worksheet C11P5 in the OM5 Data Workbook .
Question:
Perform an ABC analysis for the data provided in worksheet C11P5 in the OM5 Data Workbook. Clearly explain why you classified items as A, B, or C.
Data From OM5 Data Workbook:
| Optional Topic (Do not recommend covering except for advanced courses | |||||||
| and students but FYI; req'ds additional readings) | |||||||
| Safety Stock varies with the square root of the number of stocking points | |||||||
| for the same service level | |||||||
| EOQ | 62.00 | ||||||
| Safety Stock | 21.3 | ||||||
| Q/2 + SS | 52.32 | ||||||
| No. Stock Points | Gallons | $ Ave Inv | |||||
| 1 | 52 | $1,101 | |||||
| 2 | 74 | $1,558 | |||||
| 3 | 91 | $1,908 | |||||
| 4 | 105 | $2,203 | |||||
| 31 | 291 | $6,132 | |||||
| 50 | 370 | $7,788 | |||||
| 100 | 523 | $11,014 | |||||
| 150 | 641 | $13,489 | |||||
| 200 | 740 | $15,576 | |||||
| 231 | 795 | $16,740 | |||||
| Note: 231 is 215 secondary pts + 24 depts. + hospital storeroom + university storeroom | |||||||
| Conclusion: Additional stocking points are expensive! So try to reduce them with | |||||||
| moving carts of inventory, no stock in exam rooms, only one department store room, etc. | |||||||
Data From OM6 Data Workbook:
Fantastic news! We've Found the answer you've been seeking!
Step by Step Answer:

Answered By
Nyron Beeput
I am an active educator and professional tutor with substantial experience in Biology and General Science. The past two years I have been tutoring online intensively with high school and college students. I have been teaching for four years and this experience has helped me to hone skills such as patience, dedication and flexibility. I work at the pace of my students and ensure that they understand.
My method of using real life examples that my students can relate to has helped them grasp concepts more readily. I also help students learn how to apply their knowledge and they appreciate that very much.
1+ Reviews
10+ Question Solved
Related Book For 
OM6 operations supply chain management
ISBN: 978-1305664791
6th edition
Authors: David Alan Collier, James R. Evans
Question Posted:
