

From its first Red Lobster in 1968, the chain has grown to 675 locations, with over $1.6
Question:
From its first Red Lobster in 1968, the chain has grown to 675 locations, with over $1.6 billion in U.S. sales annually. The casual dining market may be crowded, with competitors such as Chili’s, Ruby Tuesday, Applebee’s, TGI Friday’s, and Outback, but Red Lobster’s continuing success means the chain thinks there is still plenty of room to grow. Robert Reiner, director of market development, is charged with identifying the sites that will maximize new store sales without cannibalizing sales at the existing Red Lobster locations. Characteristics for identifying a good site have not changed in 40 years; they still include real estate prices, customer age, competition, ethnicity, income, family size, population density, nearby hotels, and buying behavior, to name just a few. What has changed is the powerful software that allows Reiner to analyze a new site in 5 minutes, as opposed to the 8 hours he spent just a few years ago. Red Lobster has partnered with MapInfo Corp., whose geographic information system (GIS) contains a powerful module for analyzing a trade area (see the discussion of GIS in the chapter). With the U.S. geo-coded down to the individual block, MapInfo allows Reiner to create a psychographic profile of existing and potential Red Lobster trade areas. “We can now target areas with greatest sales potential,” says Reiner. The U.S. is segmented into 72 “clusters” of customer profiles by MapInfo. If, for example, cluster #7, Equestrian Heights (see MapInfo description below), represents 1.7% of a household base within a Red Lobster trade area, but this segment also accounts for 2.4% of sales, Reiner computes that this segment is effectively spending 1.39 times more than average (Index = 2.4/1.7) and adjusts his analysis of a new site to reflect this added weight.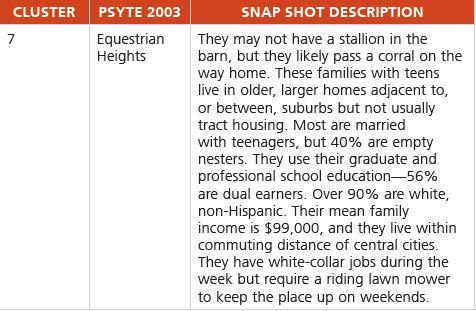
When Reiner maps the U.S., a state, or a region for a new site, he wants one that is at least 3 miles from the nearest Red Lobster and won’t negatively impact its sales by more than 8%; MapInfo pinpoints the best spot. The software also recognizes the nearness of non-Red Lobster competition and assigns a probability of success (as measured by reaching sales potential). The specific spot selected depends on Red Lobster’s seven real estate brokers, whose list of considerations includes proximity to a vibrant retail area, proximity to a freeway, road visibility, nearby hotels, and a corner location at a primary intersection. “Picking a new Red Lobster location is one of the most critical functions we can do,” says Reiner. “And the software we use serves as an independent voice in assessing the quality of an existing or proposed location.”
Discussion Questions1. Visit the Web site for PSTYE 2003 (www.gemapping.com/ downloads/targetpro_brochure.pdf). Describe the psychological profiling (PSYTE) clustering system. Select an industry, other than restaurants, and explain how the software can be used for that industry.2. What are the major differences in site location for a restaurant versus a retail store versus a manufacturing plant?3. Red Lobster also defines its trade areas based on market size and population density. Here are its seven density classes: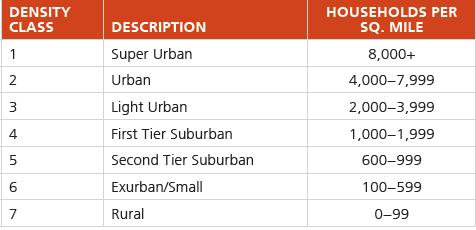
The majority (92%) of the Red Lobster restaurants fall into three of these classes. Which three classes do you think the chain has the most restaurants in? Why?
Step by Step Answer:
LOCATING THE NEXT RED LOBSTER RESTAURANT 1 MapInfo has 72 clusters that provide socioeconomic profil...View the full answer


Operations Management Sustainability And Supply Chain Management
ISBN: 9780137476442
14th Edition
Authors: Jay Heizer, Barry Render, Chuck Munson
