

Quasar Exports Ltd, a fictional Turkish manufacturer of glass, wants to use a c chart to monitor
Question:
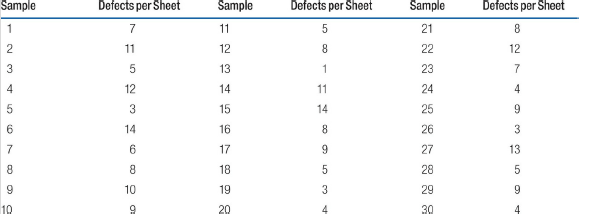
1. Why did the company choose a c-chart to monitor this process?
2. Using the data in the table, construct a c-chart using 3σ control limits.
3. After making quality improvements to the process and concluding that it is in control in the current week, the quality control manager of Quasar collected data on the number of defects per sheet for the following week using 20 glass sheets. The defects per sheet were as follows: 2, 7, 4, 5, 6, 4, 8, 1, 5, 3, 4, 4, 7, 2, 8, 3, 5, 6, 4, and 3.
Plot the data on the c-chart, and determine whether the process is in control.
Fantastic news! We've Found the answer you've been seeking!
Step by Step Answer:
1 2 A cchart is appropriate because the defects ar...View the full answer

Answered By
Mahesh G
I have more than 7 years of experience in teaching physics, mathematics and python programming to more than 600 students including both online and offline tutoring.
I follow the following 7 step fundamental approach towards tutoring.
1. Curiosity, scope, enlightenment of the topic in hand.
2. Problem Definitions and elaboration.
3. Requisite mathematics, analytical abilities and quantitative
aptitude.
4. Preparing Algorithms for problem statement.
5. Concepts with analogies and building algorithm.
6. Introspection and improvising.
7. Daily class wise Cheat sheets(its not cheating) for consolidation.
1+ Reviews
10+ Question Solved
Related Book For 

Operations Management Managing Global Supply Chains
ISBN: 978-1506302935
1st edition
Authors: Ray R. Venkataraman, Jeffrey K. Pinto
Question Posted:
