

The following data represent the interarrival time (in minutes) at a service facility: (a) Use Excel to
Question:
The following data represent the interarrival time (in minutes) at a service facility: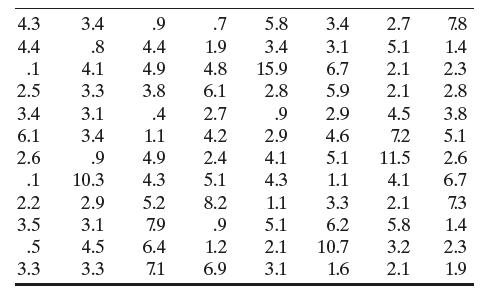
(a) Use Excel to develop three histograms for the data based on bin widths of .5, 1, and 1.5 minutes, respectively.
(b) Compare graphically the cumulative distribution of the empirical CDF and that of a corresponding exponential distribution.
(c) Test the hypothesis that the given sample is drawn from an exponential distribution. Use a 95% confidence level.
(d) Which of the three histograms is “best” for the purpose of testing the null hypothesis?
Fantastic news! We've Found the answer you've been seeking!
Step by Step Answer:
abc and d Sample Mean and Variance Histogram Outpu...View the full answer

Answered By
Utsab mitra
I have the expertise to deliver these subjects to college and higher-level students. The services would involve only solving assignments, homework help, and others.
I have experience in delivering these subjects for the last 6 years on a freelancing basis in different companies around the globe. I am CMA certified and CGMA UK. I have professional experience of 18 years in the industry involved in the manufacturing company and IT implementation experience of over 12 years.
I have delivered this help to students effortlessly, which is essential to give the students a good grade in their studies.
2+ Reviews
10+ Question Solved
Related Book For 

Question Posted:
